> ## Documentation Index
> Fetch the complete documentation index at: https://docs.tryinvesti.com/llms.txt
> Use this file to discover all available pages before exploring further.
# Analytics
> Computed signals on returns, earnings quality, valuation, capital allocation, and credit health.
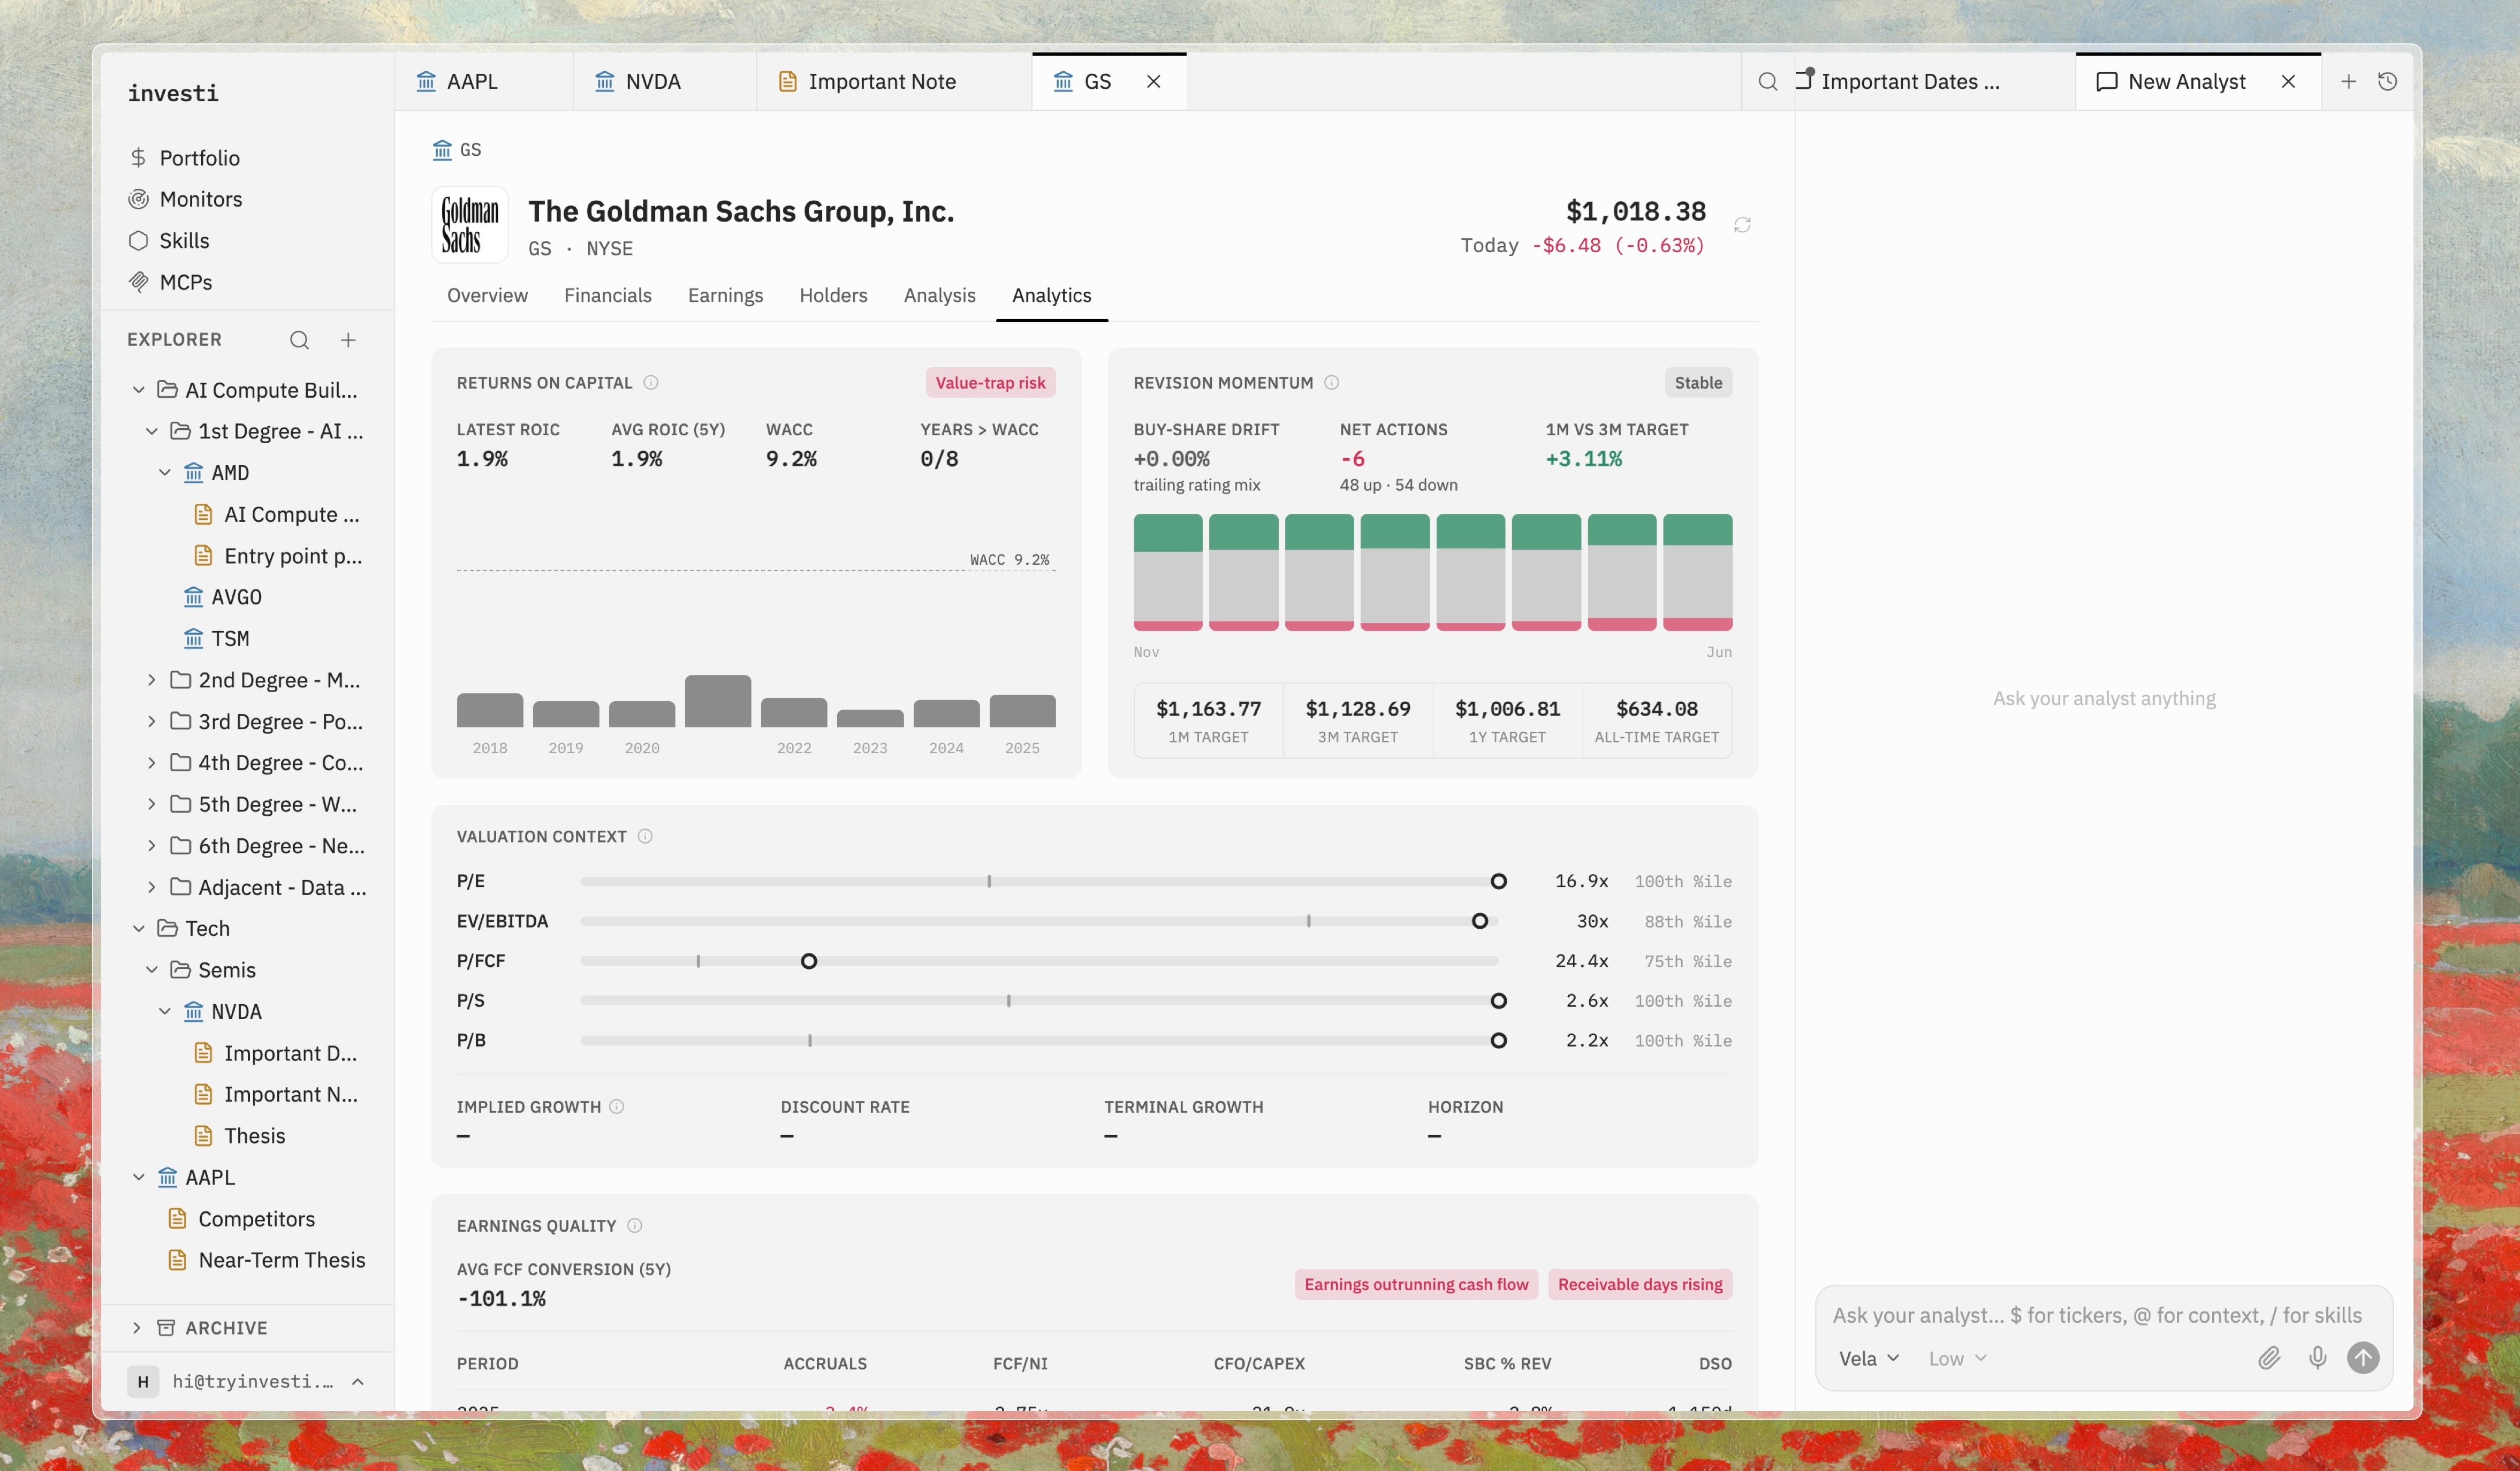
The **Analytics** section of a company tab computes higher-level signals from the raw fundamentals: the questions an analyst would work out by hand, precalculated.
 ## Cards
* **Returns on Capital**: is the business a compounder? Verdicts: *Compounder*, *Value-trap risk*, or *Mixed*.
* **Revision Momentum**: are estimates being revised up or down? *Improving*, *Deteriorating*, or *Stable*.
* **Earnings Quality**: accruals, free cash flow vs. net income, operating cash flow vs. capex, stock-based compensation as a share of revenue, and days sales outstanding.
* **Valuation Context**: current multiples against their own history.
* **Guidance Track Record**: how management's guidance has compared to what was delivered.
* **Revenue Segments**: product and geographic mix.
* **Capital Allocation**: buybacks vs. dilution (*Buying back / Diluting / Flat*) and the timing of repurchases (*Accretive timing / Poor timing*).
* **Credit**: net debt/EBITDA, debt/EBITDA, interest coverage, and current ratio, summarized as *Safe zone*, *Grey zone*, or *Distress zone*.
These are computed signals, not recommendations. Each card shows the underlying numbers so you can judge the verdict yourself.
## Cards
* **Returns on Capital**: is the business a compounder? Verdicts: *Compounder*, *Value-trap risk*, or *Mixed*.
* **Revision Momentum**: are estimates being revised up or down? *Improving*, *Deteriorating*, or *Stable*.
* **Earnings Quality**: accruals, free cash flow vs. net income, operating cash flow vs. capex, stock-based compensation as a share of revenue, and days sales outstanding.
* **Valuation Context**: current multiples against their own history.
* **Guidance Track Record**: how management's guidance has compared to what was delivered.
* **Revenue Segments**: product and geographic mix.
* **Capital Allocation**: buybacks vs. dilution (*Buying back / Diluting / Flat*) and the timing of repurchases (*Accretive timing / Poor timing*).
* **Credit**: net debt/EBITDA, debt/EBITDA, interest coverage, and current ratio, summarized as *Safe zone*, *Grey zone*, or *Distress zone*.
These are computed signals, not recommendations. Each card shows the underlying numbers so you can judge the verdict yourself.