> ## Documentation Index
> Fetch the complete documentation index at: https://docs.tryinvesti.com/llms.txt
> Use this file to discover all available pages before exploring further.
# Company dashboards
> Every company opens as a tab with live price, fundamentals, earnings, holders, analyst views, and your notes one click apart.
Add a company to your workspace (explorer **+** → **Add Company**, or Cmd+Shift+O) and it opens as a tab. Keep a dozen open at once and switch freely; data is cached, so tabs paint instantly when you come back.
 ## The company header
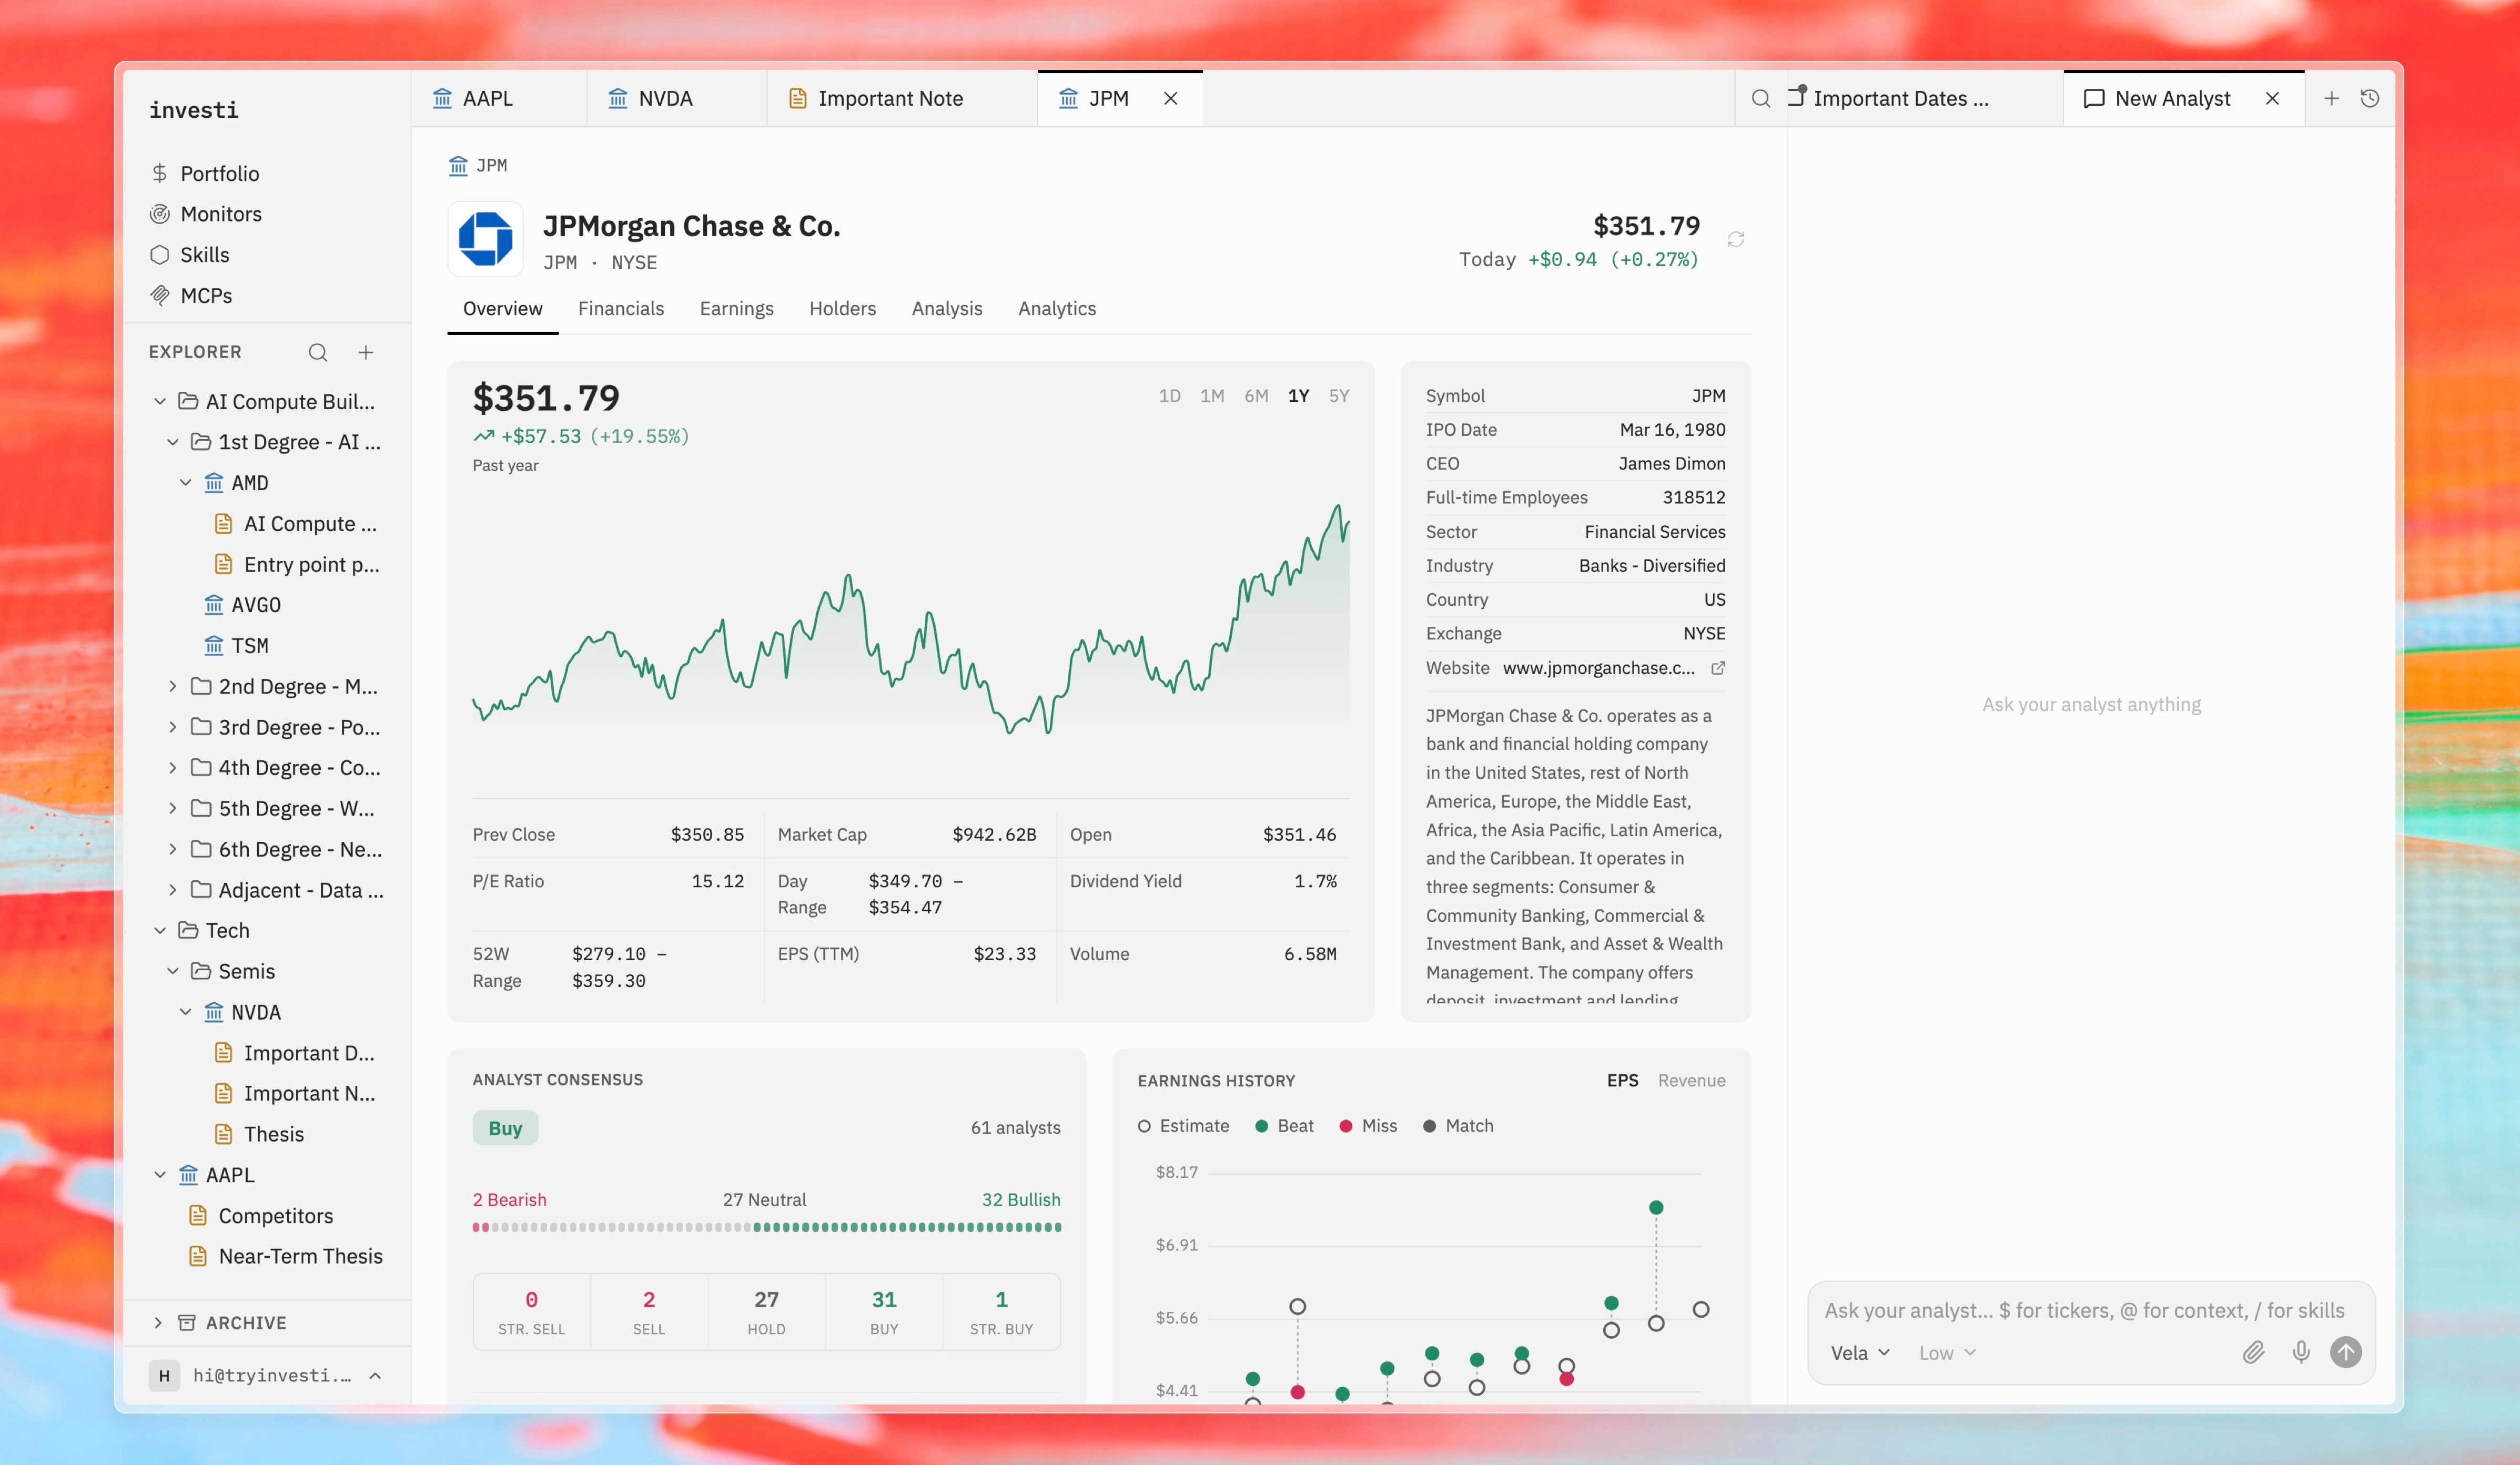
Every tab shows the company logo, name, ticker and exchange, and the live price with today's move. Delisted companies are labeled, and acquired ones show a badge linking to their acquirer. A refresh control shows when the data was last fetched and lets you force a refresh.
## Sections
A company tab has six sections:
| Section | What it covers |
| ------------------------------------- | ---------------------------------------------------------------- |
| **Overview** | Price chart, profile, quote stats, and summary cards (this page) |
| **[Financials](/company/financials)** | Statements, segments, and ratios across periods |
| **[Earnings](/company/earnings)** | Quarter-by-quarter results, transcripts, and filings |
| **[Holders](/company/holders)** | Institutional, insider, and politician activity |
| **[Analysis](/company/analysis)** | Analyst consensus, price targets, ratings, and estimates |
| **[Analytics](/company/analytics)** | Computed quality, valuation, and capital-allocation signals |
## What's on the Overview
* **Price chart** with the current quote.
* **Company profile**: symbol, IPO date, CEO, employees, sector, industry, country, exchange, and website.
* **Quote stats**: previous close, market cap, open, P/E ratio, day range, dividend yield, 52-week range, EPS (TTM), and volume.
* **Analyst consensus**: the summary card from the [Analysis](/company/analysis) section.
* **Earnings history**: EPS and revenue with beat/miss/match markers.
* **Fundamentals at a glance**: headline statement figures plus operating quality (gross, operating, and net margin).
* **Latest news**: recent stories about the company.
* **Peers**: comparable companies, each one click from its own dashboard.
Your notes live alongside the data: right-click the company in the explorer and choose **New Note** to keep a thesis inside the company itself. See [Notes](/organize/notes).
## The company header
Every tab shows the company logo, name, ticker and exchange, and the live price with today's move. Delisted companies are labeled, and acquired ones show a badge linking to their acquirer. A refresh control shows when the data was last fetched and lets you force a refresh.
## Sections
A company tab has six sections:
| Section | What it covers |
| ------------------------------------- | ---------------------------------------------------------------- |
| **Overview** | Price chart, profile, quote stats, and summary cards (this page) |
| **[Financials](/company/financials)** | Statements, segments, and ratios across periods |
| **[Earnings](/company/earnings)** | Quarter-by-quarter results, transcripts, and filings |
| **[Holders](/company/holders)** | Institutional, insider, and politician activity |
| **[Analysis](/company/analysis)** | Analyst consensus, price targets, ratings, and estimates |
| **[Analytics](/company/analytics)** | Computed quality, valuation, and capital-allocation signals |
## What's on the Overview
* **Price chart** with the current quote.
* **Company profile**: symbol, IPO date, CEO, employees, sector, industry, country, exchange, and website.
* **Quote stats**: previous close, market cap, open, P/E ratio, day range, dividend yield, 52-week range, EPS (TTM), and volume.
* **Analyst consensus**: the summary card from the [Analysis](/company/analysis) section.
* **Earnings history**: EPS and revenue with beat/miss/match markers.
* **Fundamentals at a glance**: headline statement figures plus operating quality (gross, operating, and net margin).
* **Latest news**: recent stories about the company.
* **Peers**: comparable companies, each one click from its own dashboard.
Your notes live alongside the data: right-click the company in the explorer and choose **New Note** to keep a thesis inside the company itself. See [Notes](/organize/notes).