> ## Documentation Index
> Fetch the complete documentation index at: https://docs.tryinvesti.com/llms.txt
> Use this file to discover all available pages before exploring further.
# Financials
> Income statement, balance sheet, cash flow, segments, and ratios, as tables and charts across periods.
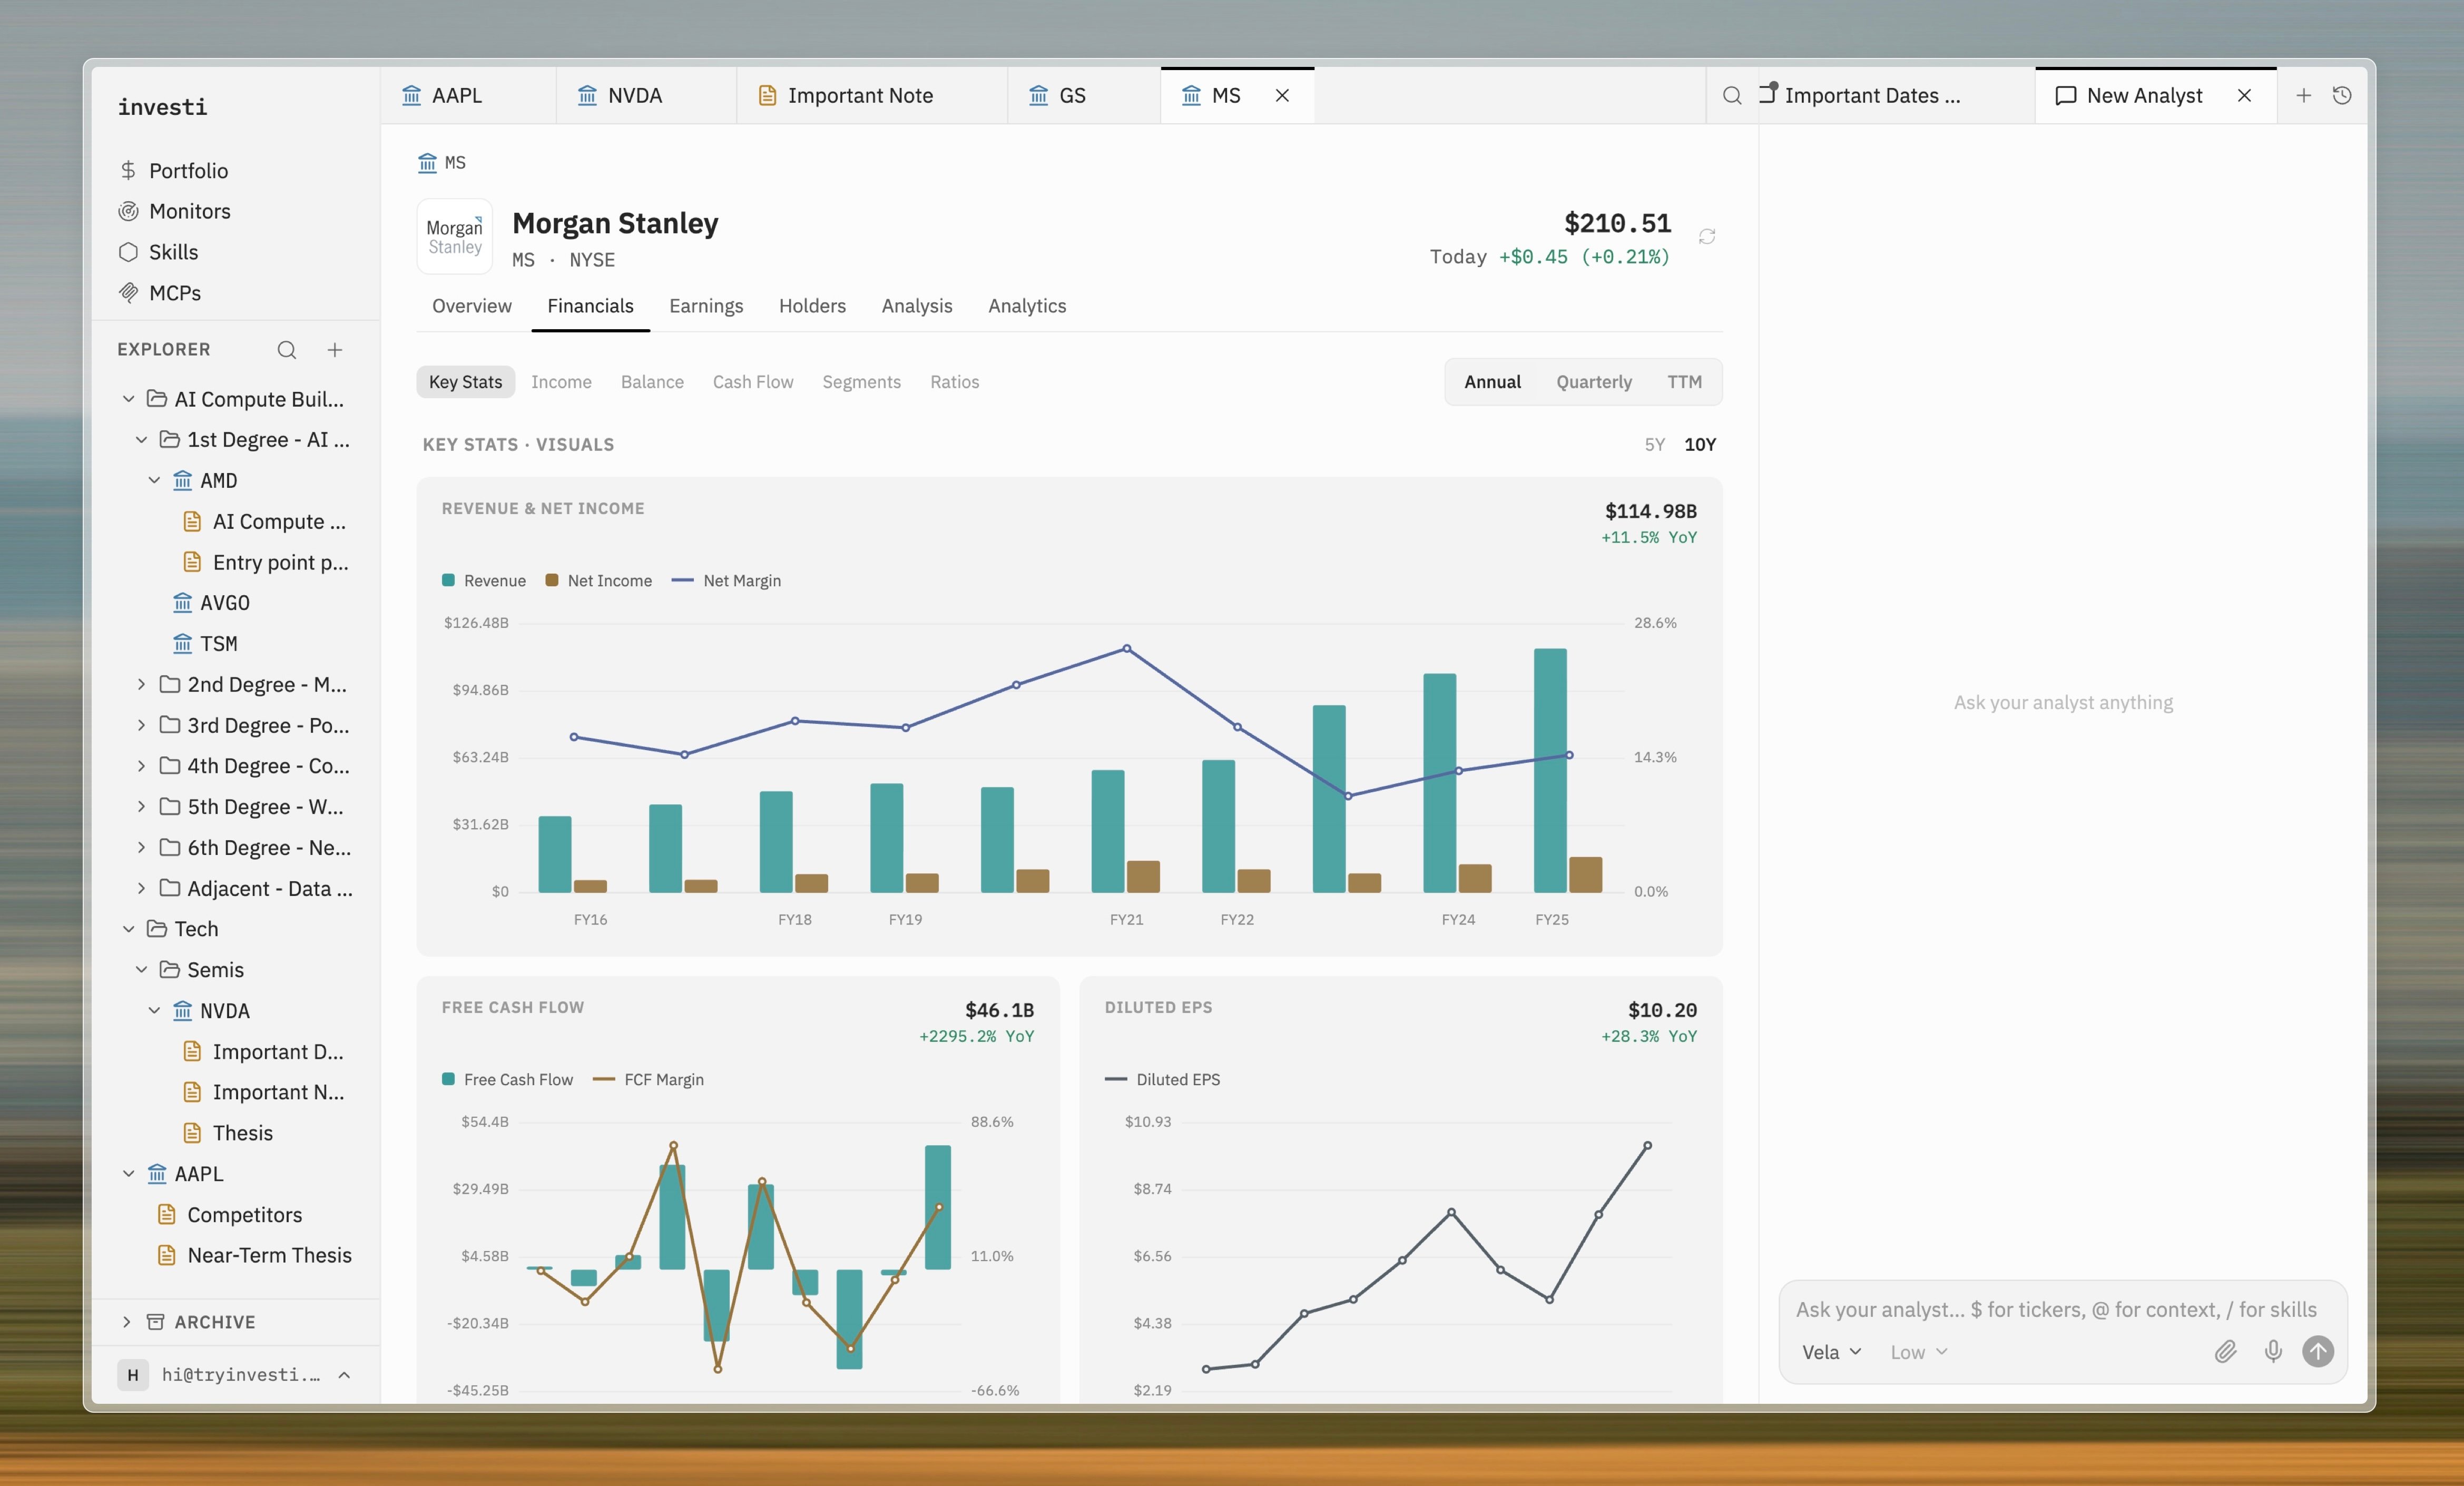
The **Financials** section of a company tab covers the statements, with a period toggle for **Annual**, **Quarterly**, and **TTM** (trailing twelve months) views.
 ## Sub-tabs
* **Key Stats**: headline figures, including an enterprise-value build-up (market cap − cash + debt = enterprise value).
* **Income**: the income statement from revenue down to diluted EPS and diluted shares.
* **Balance**: the balance sheet from cash and equivalents through net debt.
* **Cash Flow**: from net income to free cash flow.
* **Segments**: revenue broken down by product and geography, where the company reports it.
* **Ratios**: valuation and quality ratios — P/E, P/S, P/B, P/FCF, PEG, EV/EBITDA, margins, ROE, ROIC, ROA, current and quick ratio, debt/equity, interest coverage, dividend yield, and payout ratio.
Each line item is available as both a table across periods and a chart, so trends are visible at a glance.
The analyst reads the same data. Asking `How has $NVDA's gross margin trended?` in chat pulls the actual statement figures, and you can verify them here.
## Sub-tabs
* **Key Stats**: headline figures, including an enterprise-value build-up (market cap − cash + debt = enterprise value).
* **Income**: the income statement from revenue down to diluted EPS and diluted shares.
* **Balance**: the balance sheet from cash and equivalents through net debt.
* **Cash Flow**: from net income to free cash flow.
* **Segments**: revenue broken down by product and geography, where the company reports it.
* **Ratios**: valuation and quality ratios — P/E, P/S, P/B, P/FCF, PEG, EV/EBITDA, margins, ROE, ROIC, ROA, current and quick ratio, debt/equity, interest coverage, dividend yield, and payout ratio.
Each line item is available as both a table across periods and a chart, so trends are visible at a glance.
The analyst reads the same data. Asking `How has $NVDA's gross margin trended?` in chat pulls the actual statement figures, and you can verify them here.