

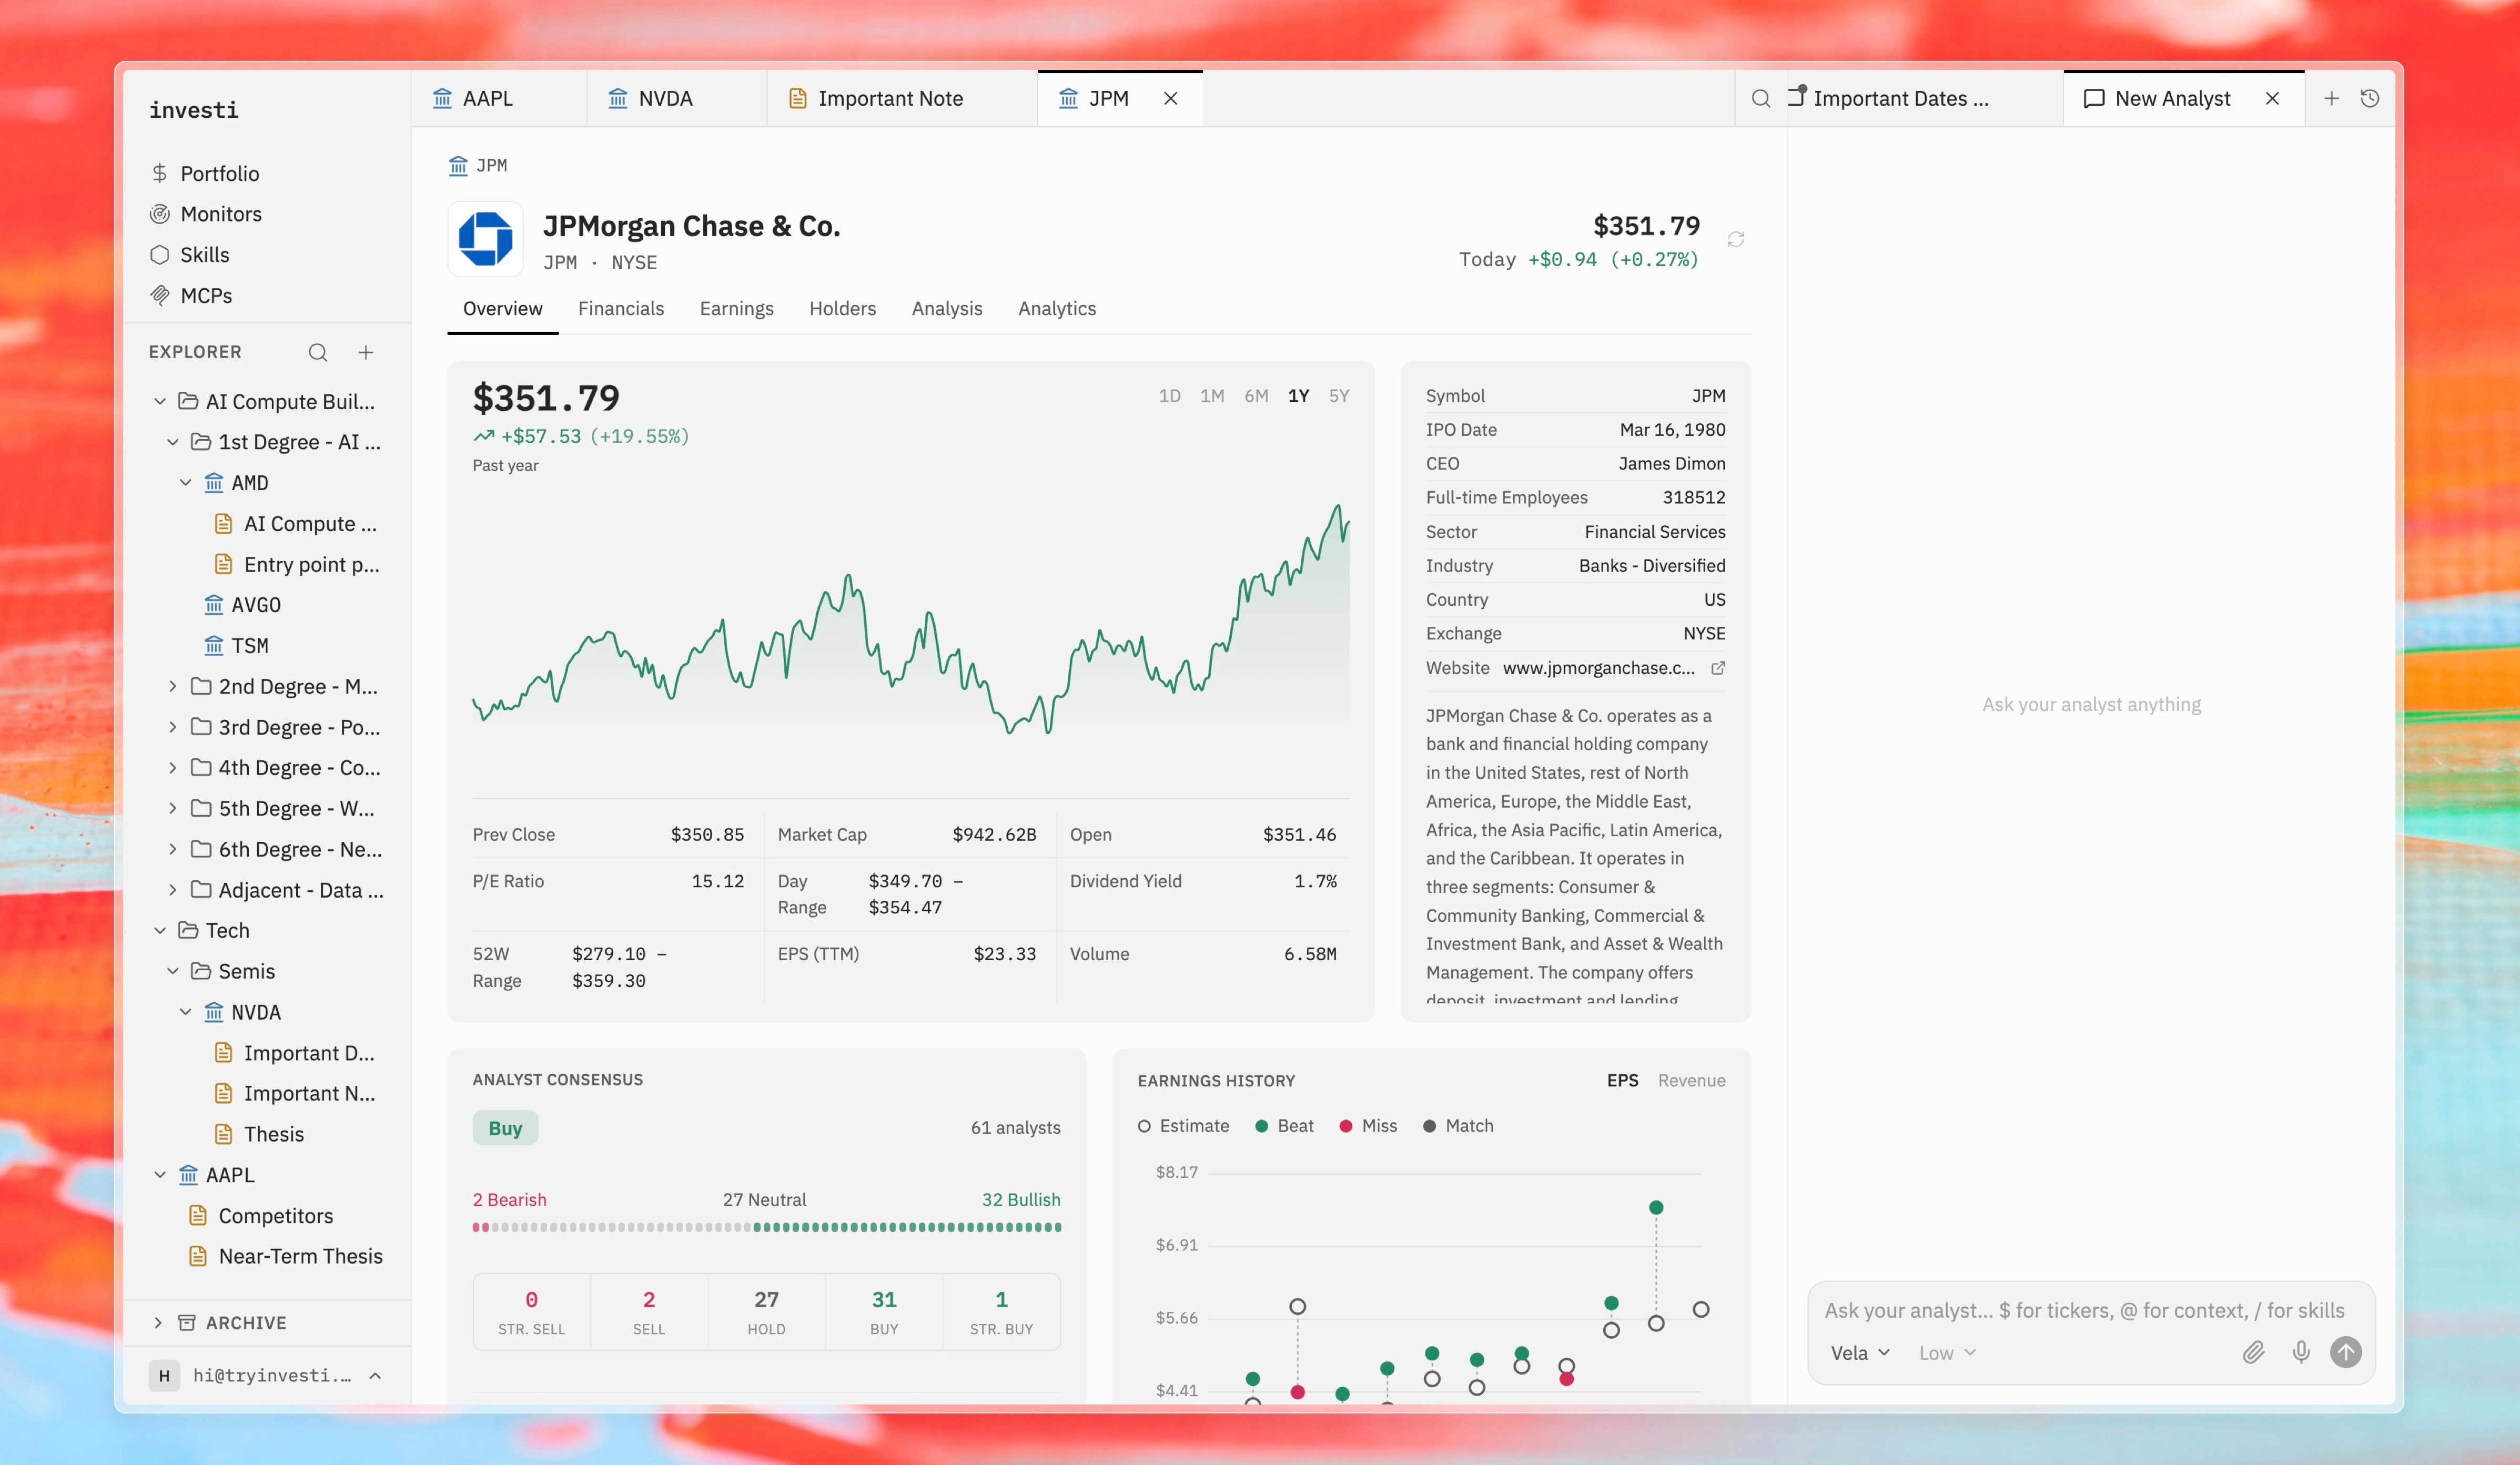
The company header
Every tab shows the company logo, name, ticker and exchange, and the live price with today’s move. Delisted companies are labeled, and acquired ones show a badge linking to their acquirer. A refresh control shows when the data was last fetched and lets you force a refresh.Sections
A company tab has six sections:What’s on the Overview
- Price chart with the current quote.
- Company profile: symbol, IPO date, CEO, employees, sector, industry, country, exchange, and website.
- Quote stats: previous close, market cap, open, P/E ratio, day range, dividend yield, 52-week range, EPS (TTM), and volume.
- Analyst consensus: the summary card from the Analysis section.
- Earnings history: EPS and revenue with beat/miss/match markers.
- Fundamentals at a glance: headline statement figures plus operating quality (gross, operating, and net margin).
- Latest news: recent stories about the company.
- Peers: comparable companies, each one click from its own dashboard.