

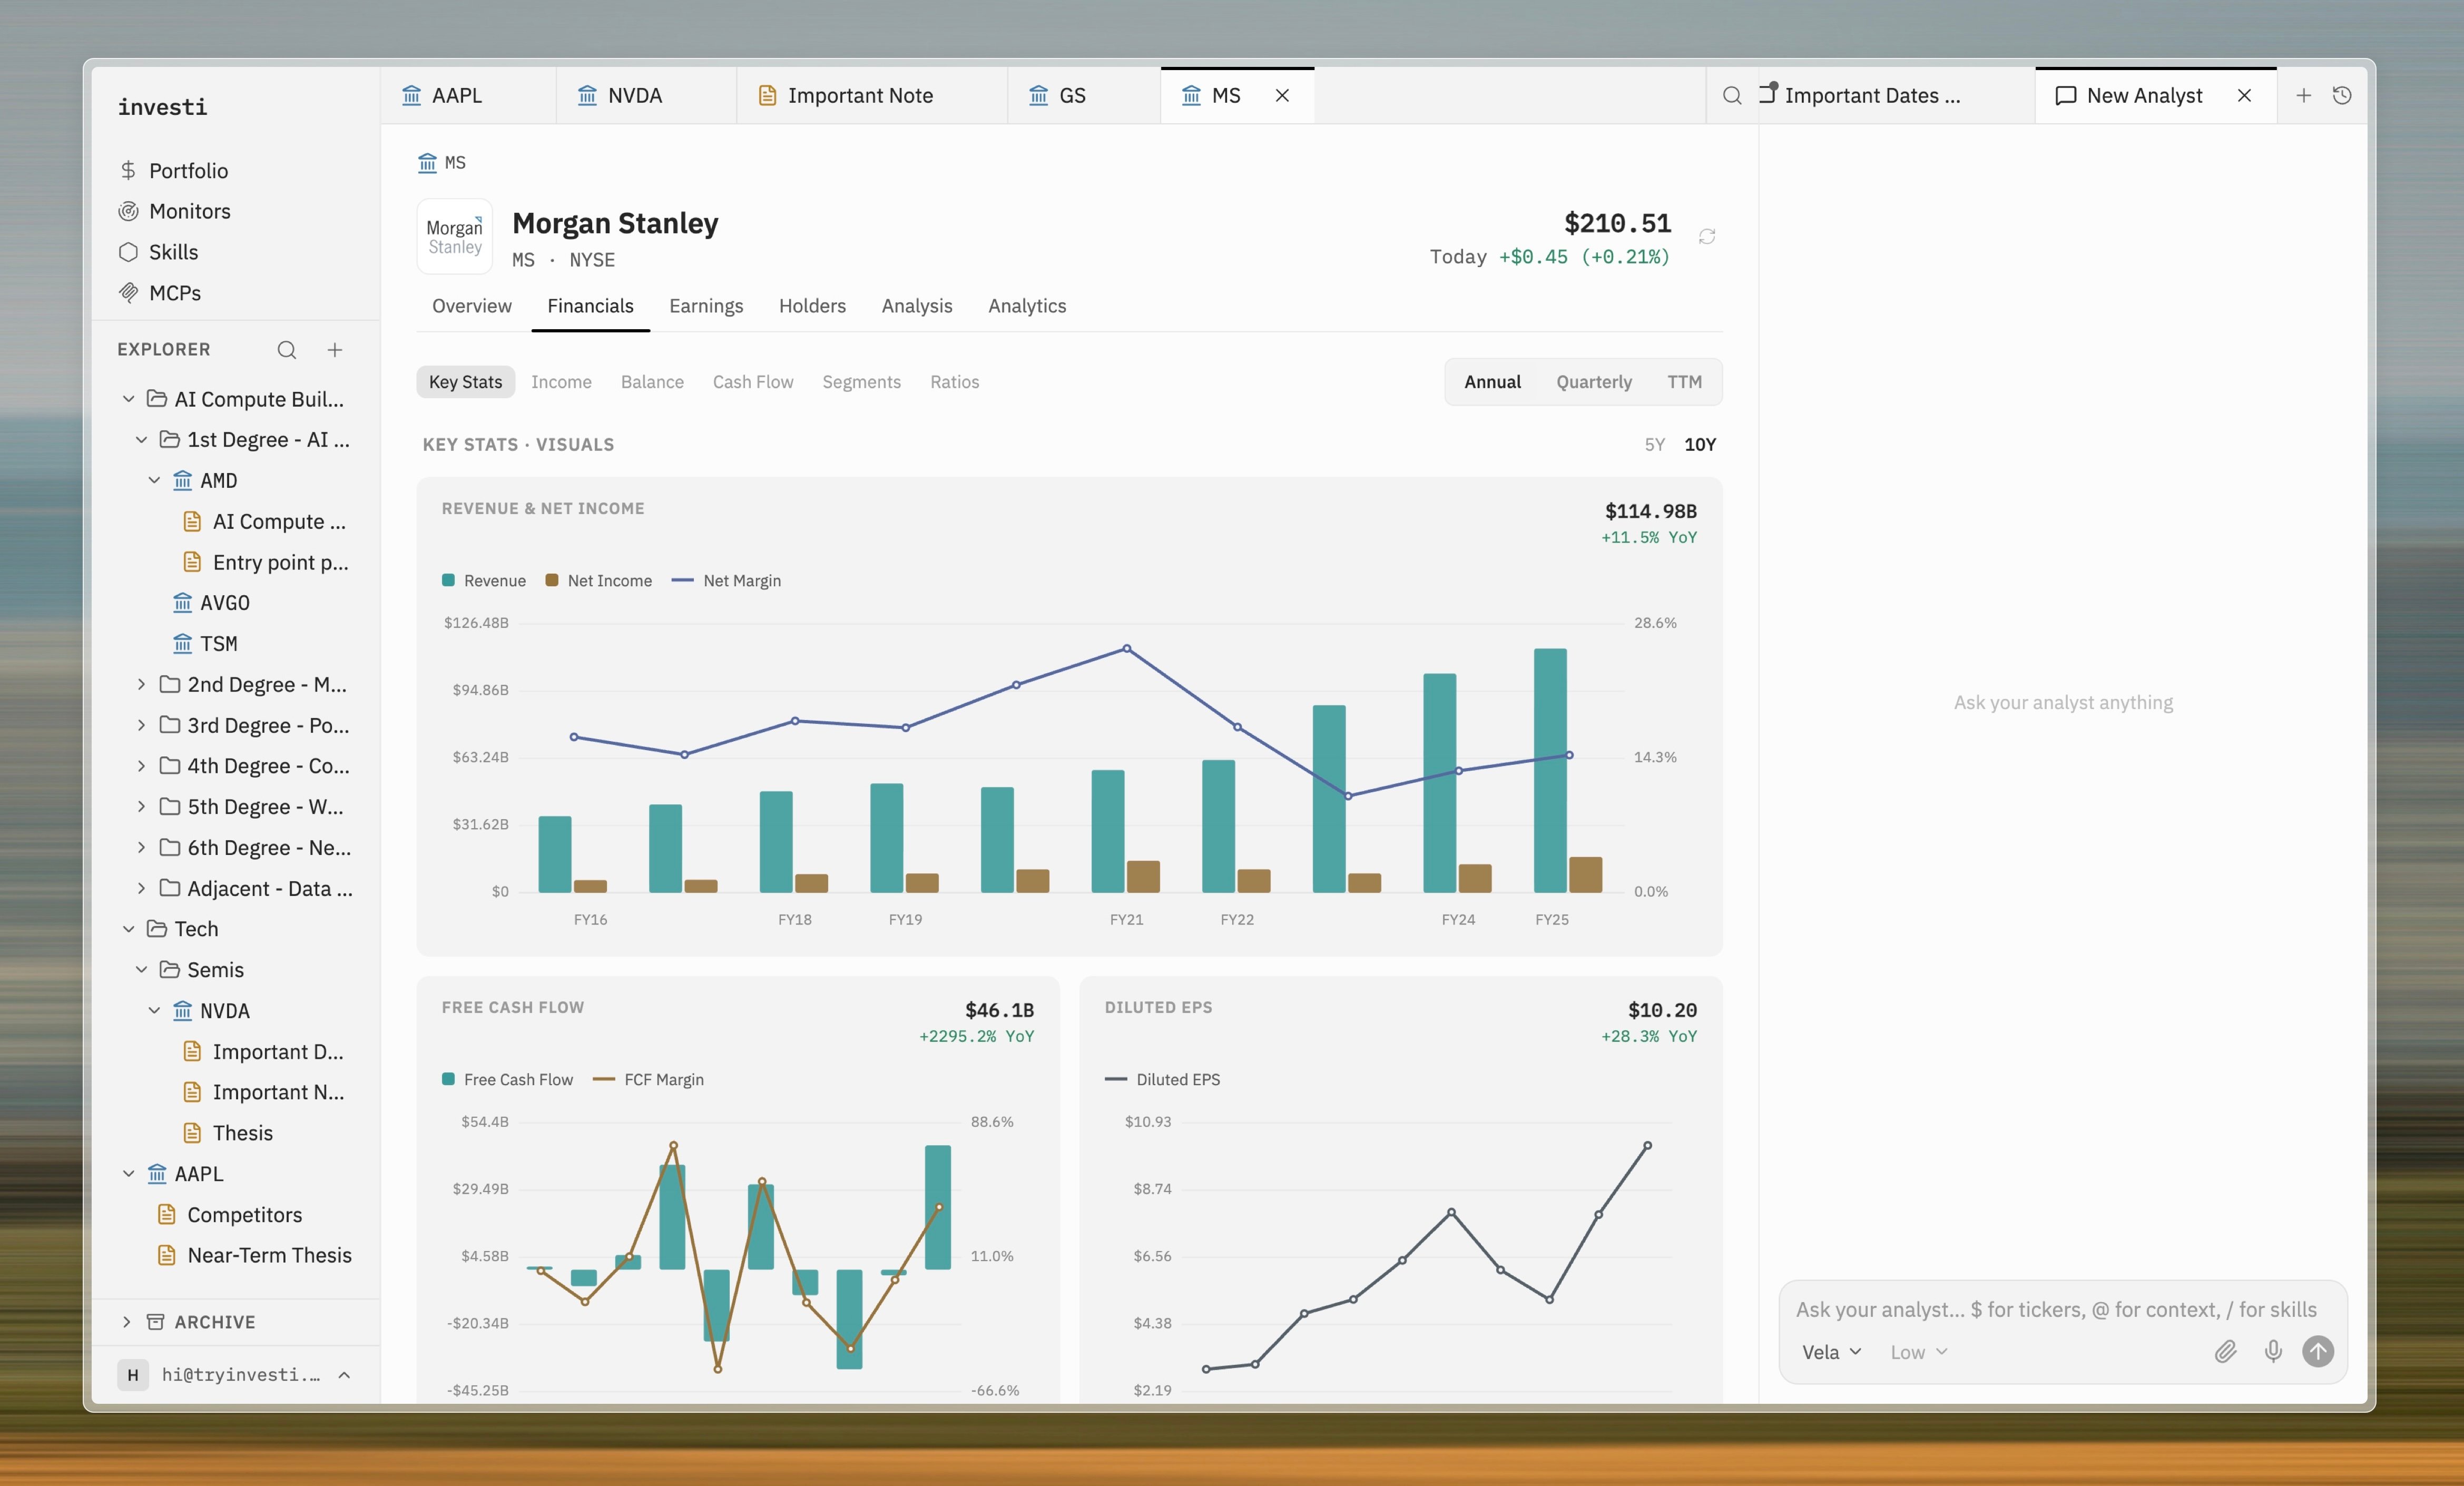
Sub-tabs
- Key Stats: headline figures, including an enterprise-value build-up (market cap − cash + debt = enterprise value).
- Income: the income statement from revenue down to diluted EPS and diluted shares.
- Balance: the balance sheet from cash and equivalents through net debt.
- Cash Flow: from net income to free cash flow.
- Segments: revenue broken down by product and geography, where the company reports it.
- Ratios: valuation and quality ratios, including P/E, P/S, P/B, P/FCF, PEG, EV/EBITDA, margins, ROE, ROIC, ROA, current and quick ratio, debt/equity, interest coverage, dividend yield, and payout ratio.
How has ‘s gross margin trended?